annual_2016
64/76
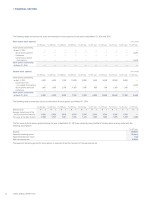
The following tables summarize the scale and movement of stock options for the years ended March 31, 2016 and 2015:(Non-vested stock options)(unit: shares)The 2006 planThe 2007 planThe 2008 planThe 2009 planThe 2010 planThe 2011 planThe 2012 planThe 2013 planThe 2014 planThe 2015 planStock options outstanding at April 1, 2015——————————Stock options granted—————————14,600Forfeitures——————————Conversion to vested stock options—————————14,600Stock options outstanding at March 31, 2016——————————(Vested stock options)(unit: shares)The 2006 planThe 2007 planThe 2008 planThe 2009 planThe 2010 planThe 2011 planThe 2012 planThe 2013 planThe 2014 planThe 2015 planStock options outstanding at April 1, 20154,9004,5007,90012,00010,9007,60014,50022,00018,300—Conversion from non-vested stock options—————————14,600Stock options exercised1,6001,6002,7004,3003,7008009001,4001,100—Forfeitures——————————Stock options outstanding at March 31, 20163,3002,9005,2007,7007,2006,80013,60020,60017,20014,600The following table summarizes the price information of stock options as of March 31, 2016:The 2006 planThe 2007 planThe 2008 planThe 2009 planThe 2010 planThe 2011 planThe 2012 planThe 2013 planThe 2014 planThe 2015 planExercise price¥ 1¥ 1¥ 1¥ 1¥ 1¥ 1¥ 1¥ 1¥ 1¥ 1Average market price of the stock at the time of exercise2,5462,5462,5102,5102,5102,7462,7462,7462,746—Fair value at the date of grant2,7881,9471,4811,7261,4741,3031,2031,5951,8252,283The fair value of stock options granted during the year ended March 31, 2016 was valued by using the Black Scholes option pricing model with the following assumptions:The 2015 planVolatility35.883%Expected remaining period10 yearsExpected dividend per share¥ 48Risk free interest rate0.360%The expected remaining period for stock options is assumed to be the mid-point of the exercise period.LINTEC ANNUAL REPORT 201662:: FINANCIAL SECTION
元のページ